Varukorgen är tom
Undervisningsmjukvaror
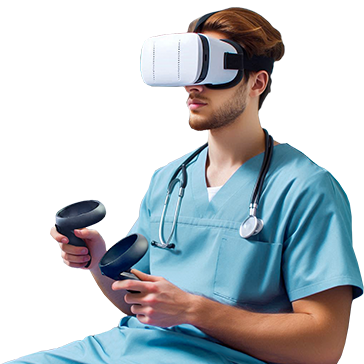
mozaMedical
Digital complex learning materials for health sciences
To deepen and check your knowledge in health sciences, use the mozaMedical STUDENT licence. To give a presentation in a classroom or at a conference, or if you have a low-speed Internet connection, choose the mozaMedical PRESENTER licence. For institutional discounts, please contact our colleagues.
mozaMedical - Digital complex learning materials for health sciences
mozaMedical PERSONAL
För elever - studier och övning
- Access to digital lessons
- Use of educational simulations with or without VR glasses
- Compatible with every device
XR Extended Reality
99 EUR/Användare
Användare

mozaMedical PROFESSIONAL
För föreläsare - undervisning och presentationer
- Fascinating courses with one click
- Interactive tools for assessment
- Presentations on large displays during classes and conferences
XR Extended Reality
198 EUR/Användare
Användare
*PACK-licens: licenser köpta i paket har en gemensam aktiveringskod som kan användas på lika många enheter som antalet licenser i paketet.
Användarlicens
En användarlicens ger en användare möjjlghet att logga in på olika enheter (t.ex. datorer, interaktiva skrivtavlor, bärbara datorer, surfplattor eller smartphones) med sitt eget användarnamn och lösenord. Användaren kan använda både mozaBook och mozaWeb men kan bara vara inloggad på en enhet åt gången. Denna licenstyp rekommenderas när användarna arbetar på sina egna datorer eller vill få tillgång till Mozaik-plattformen på flera enheter.
Enhetsbaserad licens
En enhetsbaserad licens ger obegränsat antal användare tillgång till programvaran på en given enhet. I det här fallet behöver användare inte ha egna licenser. Denna licens rekommenderas när flera lärare eller elever använder samma enhet. I detta fall behöver endast enheten ha en licens oavsett antal lärare eller elever som använder den. Juridisk information som ska godkännas före köp
Genom att köpa en School Admin-licens bekräftar jag härmed att:
- Jag köper licensen med läroanstaltens uttryckliga tillstånd och kommer uteslutande att använda den för dess räkning och i enlighet med dess officiella syften.
- Jag är medveten om att olaglig användning av licensen, särskilt obehörig behandling av personuppgifter, betraktas som brott.
- Jag är medveten om mitt straffrättsliga ansvar och försäkrar att jag tar på mig allt juridiskt och etiskt ansvar i samband med köpet och att jag är medveten om att alla olagliga handlingar, särskilt missbruk av användardata, kommer att få rättsliga konsekvenser.
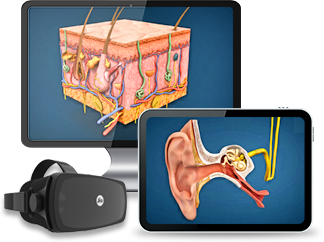
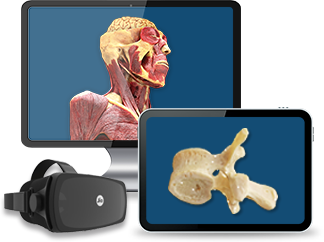
cadaVR - Digital anatomisk atlas
cadaVR PERSONAL
För elever - studier och övning
- En användarlicens som ger en elev möjlighet att använda den digitala anatomiska atlasen på flera enheter.
- Full tillgång till interaktivt innehåll, frågesporter och VR-funktion (PC VR).
XR Extended Reality
Pack-licens*
99 EUR/Användare
Användare

cadaVR PROFESSIONAL
För lärare - undervisning och presentationer
- En användarlicens som ger en lärare eller läkare möjlighet att använda den digitala anatomiska atlasen på flera enheter inklusive projektor och interaktiv skrivtavla.
- Full tillgång till interaktivt innehåll, frågesporter och VR-funktion (PC VR).
- Snabbare drift, mindre datatrafik - nedladdningsbara 3D-modeller för att minska datatrafiken.
XR Extended Reality
Pack-licens*
198 EUR/Användare
Användare
*PACK-licens: licenser köpta i paket har en gemensam aktiveringskod som kan användas på lika många enheter som antalet licenser i paketet.
Användarlicens
En användarlicens ger en användare möjjlghet att logga in på olika enheter (t.ex. datorer, interaktiva skrivtavlor, bärbara datorer, surfplattor eller smartphones) med sitt eget användarnamn och lösenord. Användaren kan använda både mozaBook och mozaWeb men kan bara vara inloggad på en enhet åt gången. Denna licenstyp rekommenderas när användarna arbetar på sina egna datorer eller vill få tillgång till Mozaik-plattformen på flera enheter.
Enhetsbaserad licens
En enhetsbaserad licens ger obegränsat antal användare tillgång till programvaran på en given enhet. I det här fallet behöver användare inte ha egna licenser. Denna licens rekommenderas när flera lärare eller elever använder samma enhet. I detta fall behöver endast enheten ha en licens oavsett antal lärare eller elever som använder den. Juridisk information som ska godkännas före köp
Genom att köpa en School Admin-licens bekräftar jag härmed att:
- Jag köper licensen med läroanstaltens uttryckliga tillstånd och kommer uteslutande att använda den för dess räkning och i enlighet med dess officiella syften.
- Jag är medveten om att olaglig användning av licensen, särskilt obehörig behandling av personuppgifter, betraktas som brott.
- Jag är medveten om mitt straffrättsliga ansvar och försäkrar att jag tar på mig allt juridiskt och etiskt ansvar i samband med köpet och att jag är medveten om att alla olagliga handlingar, särskilt missbruk av användardata, kommer att få rättsliga konsekvenser.
För läroanstalter - Complete solution for educational institutions

INSTITUTE licence
- Tillgång på institutionsnivå som ger full tillgång till lärare, elever och personal vid en läroanstalt för vård och omsorg, ett anatomiskt institut eller en vårdcentral.
- Full tillgång till interaktivt innehåll, frågesporter och VR-funktion (PC VR).
- Snabbare drift, mindre datatrafik - nedladdningsbara 3D-modeller för att minska datatrafiken.
Användarlicens
En användarlicens ger en användare möjjlghet att logga in på olika enheter (t.ex. datorer, interaktiva skrivtavlor, bärbara datorer, surfplattor eller smartphones) med sitt eget användarnamn och lösenord. Användaren kan använda både mozaBook och mozaWeb men kan bara vara inloggad på en enhet åt gången. Denna licenstyp rekommenderas när användarna arbetar på sina egna datorer eller vill få tillgång till Mozaik-plattformen på flera enheter.
Enhetsbaserad licens
En enhetsbaserad licens ger obegränsat antal användare tillgång till programvaran på en given enhet. I det här fallet behöver användare inte ha egna licenser. Denna licens rekommenderas när flera lärare eller elever använder samma enhet. I detta fall behöver endast enheten ha en licens oavsett antal lärare eller elever som använder den. Juridisk information som ska godkännas före köp
Genom att köpa en School Admin-licens bekräftar jag härmed att:
- Jag köper licensen med läroanstaltens uttryckliga tillstånd och kommer uteslutande att använda den för dess räkning och i enlighet med dess officiella syften.
- Jag är medveten om att olaglig användning av licensen, särskilt obehörig behandling av personuppgifter, betraktas som brott.
- Jag är medveten om mitt straffrättsliga ansvar och försäkrar att jag tar på mig allt juridiskt och etiskt ansvar i samband med köpet och att jag är medveten om att alla olagliga handlingar, särskilt missbruk av användardata, kommer att få rättsliga konsekvenser.
Jämför prenumerationer - mozaMedical
| PERSONAL LICENS | PROFESSIONAL-LICENS | |
| LISTPRIS (1 licens/år) | 99 EUR/Användare |
198 EUR/Användare |
| PACK-licens/år (åtminstone 10 licenser | 89 EUR/Användare |
178 EUR/Användare |
| PACK-licens/år (åtminstone 30 licenser | 84 EUR/Användare |
168 EUR/Användare |
| PACK-licens/år (åtminstone 100 licenser | 79 EUR/Användare |
158 EUR/Användare |
| Prenumerationstyp | Användarlicens | Användarlicens |
| Hur många användare kan använda den? | en | en |
| Hur många enheter kan den användas på? | flera | flera |
| Tillgängliga funktioner | PERSONAL | PROFESSIONAL |
| Interaktiv skrivtavla/Projektor/Stor skärm (större än 30") | ||
| Stöd för VR-enheter/PC VR | ||
| Oculus Quest 2 | Kommer snart | Kommer snart |

Användarlicens
En användarlicens ger en användare möjjlghet att logga in på olika enheter (t.ex. datorer, interaktiva skrivtavlor, bärbara datorer, surfplattor eller smartphones) med sitt eget användarnamn och lösenord. Användaren kan använda både mozaBook och mozaWeb men kan bara vara inloggad på en enhet åt gången. Denna licenstyp rekommenderas när användarna arbetar på sina egna datorer eller vill få tillgång till Mozaik-plattformen på flera enheter. |
||